
Logging Rethought
The Current State Of Logging
We build services, potentially used by hundreds, thousands or even millions of people. And despite all the testing we do, some operations and interactions with these services will not work out the way we expect or hope. Wouldn’t it be great to be able to reconstruct and understand what led to a problem? And then analyze if the same problem occurred at other times to possibly find the root cause of the problem?
Historically, we’ve used some form of plain text or prose-style logging within the applications we build and operate. Code like the following is not uncommon:
logger.error(
    "Login failed because the connection to the authentication provider "
    "%s timed out.",
    provider_name
)
This message is comprehensible and provides a lot of valuable information to a human reader. The message will either be written to a file, the standard output or some service that will do something with it.
Often, these log messages will not be looked at until something is broken. Typically, at that time, an engineer will need to sort through and scroll through thousands of lines of text until they eventually find this one message among a billion other messages:
[2019-04-01T10:47:04.139+00:00] [ERROR] [srv01] Login failed because the connection to the authentication provider google timed out.
It is then up to them to understand and deduce that probably a user tried to log in using credentials for an external authentication provider called google. They can also understand that the login did not succeed because the connection between the application and the authentication provider was too slow or otherwise interrupted and thus timed out.
Our Logging Is Broken
While the message mentioned above is understandable and provides some valuable information to a human reader, it does not provide any helpful information for the problem at hand at all. In retrospect, nobody will easily be able to figure out the problem given this message.
To understand what information would be helpful, we’d need to look at the situation from the perspective of the one dealing with the incident: What IP and host did the server try to connect to? What was the timeout limit at the time? How many other attempts were made to talk to that authentication provider? Where other outgoing connections affected by timeout errors as well? Were other servers affected by the same problem?
Tracing Events
The scenario above was rather well constrained: a single application having trouble talking to some external service. However, most systems these days are not that simple anymore; they’re built with a macro-service or microservice architecture in mind. There are half a dozen to hundreds of individual services doing work.
One of the key problems that come with a macro- and microservice architecture is its complexity in dependencies. One service depends on another that depends on another that depends on another. When one service causes problems, chances are, other services are not running smoothly either.
Often, communication between individual services is handled via HTTP requests. To better understand how requests — or more generally events — relate to each other, what request triggered what other request and what failed request caused another request to fail, one can tag each request with a Request ID or a Trace ID and provide that identifier along with log messages. Additionally, these trace IDs are passed on to sub-requests. This concept is generally known Event Tracing.
Tracing Errors
When combined with error tracing tools, such as Sentry, attaching a trace ID to the error event would allow whoever investigates it to look up all log messages related to that event. And with that additional context, they are better equipped in identifying, understanding, and resolving the problem than without it.
There Is More Out There Than HTTP
But event tracing does not need to stop at the HTTP request/response level. Messages put into a queue can contain the trace ID as well. This allows workers processes to pull the trace ID from the message when they start their work and attach that trace ID to every log message they are writing. When looking at the collection of log messages for a given trace ID from all different services, the log messages from workers would show up as well and give viable information why, for example, some service was talked to or why not.
Tracing Users And Other Objects
While tracing events, especially across service boundaries, is already a considerable improvement and significant benefit compared to typical logging behavior, it’s not the only thing that can be traced. Anything with an identifier can be traced.
To give an example, a request that comes into one service will cause a request to an authentication service, which will return the authenticated user to the first service. Log messages within the first service that are written before the user was authenticated must clearly identify it as such, and so must log messages after a user was authenticated. That allows for a much easier understanding of why something failed: because the user in question hadn’t been authenticated yet.
Similarly, one could trace any object by its identifier throughout the entire service architecture.
Adding Structure To Our Logs
Let’s look back at the log message from above:
logger.error(
    "Login failed because the connection to the authentication provider "
    "%s timed out.",
    provider_name
)
As already mentioned, this log message does not really give any meaningful information. It’s at least missing the target IP address, the timeout limit. Either can be added easily to the message:
logger.error(
    "Login failed because the connection to the authentication provider "
    "%s @ %s timed out after %s ms.",
    provider_name,
    provider_ip,
    timeout,
)
This will then result in a message much like this:
[2019-04-01T10:47:04.139+00:00] [ERROR] [srv01] Login failed because the connection to the authentication provider google @ 8.8.8.8 timed out after 5 ms.
Now, this log message is already far more helpful. Firstly, the IP of the authentication provider seems to be 8.8.8.8. Everybody knows this IP address points to Google’s public DNS service and not some authentication provider. Secondly, the timeout is five milliseconds, that’s hardly enough time for a PING round-trip on a dodgy WiFi connection (or about 1500km return — 750km one way).
The problem here is, though, attaching all this information to some prose-style messages makes them rather tedious and hard to read and terrible to understand. Additionally, questions regarding the locality of the problem, its frequency, etc. are still not easy to answer.
A solution to solve all these troubles that the traditional logging approaches seem to have can be structured logging. With structured data, when appropriately presented to an individual, it contains not only the explicit information that’s already part of the message above, but the presentation itself can convey additional information.
This post is going to use structlog for demonstration purposes.
Similar to before, the application will need to log events. But instead of using a prose message an event key or event identifier is used [1]. Additionally, further information is passed along as keyword arguments.
import structlog
logger = structlog.get_logger("structlog")
logger.error(
    "auth_provider_failed",
    provider_name=provider_name,
    provider_ip=provider_ip,
    timeout=timeout,
)
When looking at how the event is recorded internally, it may look like this:
{
    "event": "auth_provider_failed",
    "timestamp": 1554115624.139,
    "level": "error",
    "provider_name": "google",
    "provider_ip": "8.8.8.8",
    "timeout": 5,
}
On top of the data given, there is a timestamp and a level item. They were added by structlog automatically.
Now that there is structured data, the event record can be printed out to something a human can easier grasp. For that, structlog provides a simplistic KeyValueRenderer and a more fancy, colorizing, ConsoleRenderer. Using them, once can expect an output that’s close to this:
2019-04-01 10:47:04.139 [error ] auth_provider_failed [structlog] provider_name='google' provider_ip='8.8.8.8' timeout=5
While the KeyValueRenderer and the ConsoleRenderer are great for development, they still provide almost unparsable output and thus make the whole point of having structured logging mood. In deployed environments, a renderer like the JSONRenderer will come in handy. It serializes the dictionary shown above into a JSON string:
{"event": "auth_provider_failed", "timestamp": 1554115624.139, "level": "error", "provider_name": "google", "provider_ip": "8.8.8.8", "timeout": 5}
WYSIWYU – What You See Is What You Understand
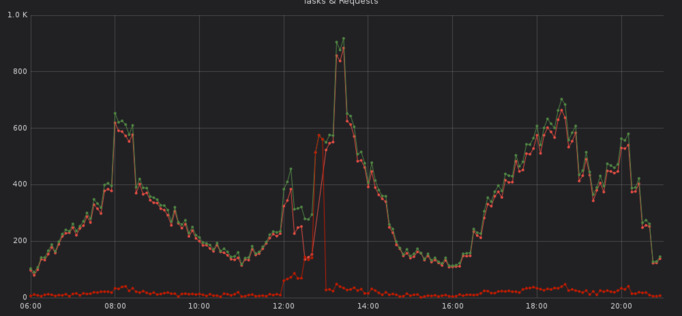
As we all know, JSON is a format understood by pretty much every application out there. When the JSON object is written to a log file that file can be watched by tools like fluentd or filebeat. These services can ingested the log records into some long-term storage like CrateDB. Visualization tools like Grafana can then be used to turn the events into a graph which a human eye is better at recognizing than at finding a log message among a thousand others.
As an example, when looking at the following graph, one can see that there is something happening out of the ordinary around the 12:50pm. With timezones in mind, 12:50pm Berlin time is about the same time as 10:47 UTC on April 1st, 2019, and thus around the time of the event that was recorded above.

Without even looking at any logs, one would be able to say that something is broken.
A Picture Says More Than A Thousand Words
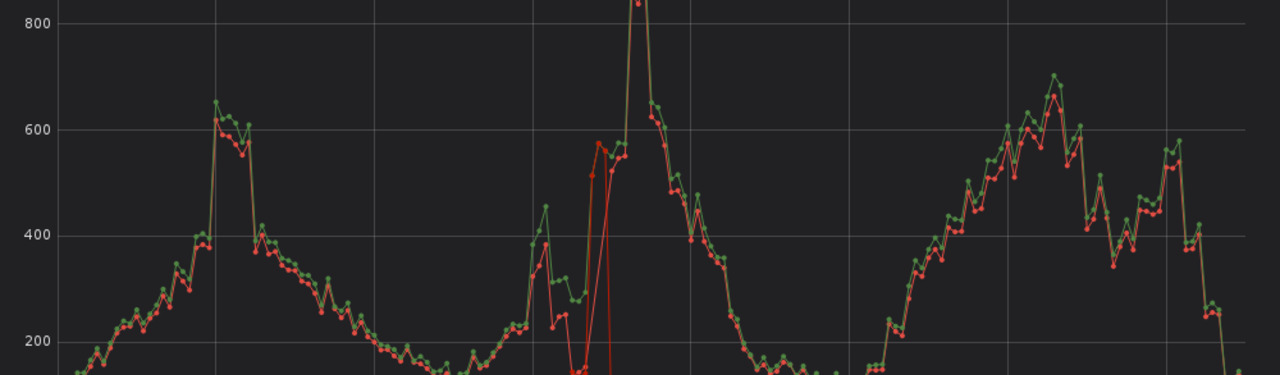
Consulting two additional graphs — the first one shows the number of log messages per log level over time, the second is about the number of started, finished and failed requests over time — additional information is revealed.


At some time around 12pm Berlin time, an increase in failed requests and error messages can be seen. Together with the previous findings, there is a high likelyhood that the error with the authentication provider at 12:47pm was caused by something that happened around 12pm.
As an engineer, this piece of information is vital. Because that at the log messages around 12pm could then reveal that e.g. a deployment happened, or that somebody changed some configurtaion value.
Furthermore, the first graphs also shows that the error about the authentication provider is not an isolated incident but part of a bigger problem.
Structuring My Django Logs
All the above is nice and fancy and shiny and seems to be the unicorn everybody wishes for. But how can structured logging be used in a real application?
There is a repository with a bunch of different logs on my GitLab account. It comes with a docker-compose setup of a couple of different services that interact with each other. It comes with a fluentd setup that writes log messages into a CrateDB instance. And a Grafana dashboard showing some graphs.
Logging For European Users
When logging information, potentially data about users and customers ends up in those logs. Since th EU has graciously provided the beloved GDPR, there is obviously no way to just log whatever one wants.
To keep this section short, a few tips on what to avoid when logging:
Never log any secrets. EVER!
Ensure your log data store is secured and not world-readable! NO, REALLY!
Explicitly log whatever should end up in logs:
# DO
logger.error("some_event", foo="bar", lorem="ipsum")

# DON'T DO
logger.error("some_event", **some_object.__dict__)
Come up with a naming scheme and convention for event names before you begin.
Rather log a bit too much than too little.
Log object IDs as well as their attributes where it makes sense. The attributes may change over time.
Improve as you learn. Add missing information when you notice it would be great to have it.
| [1] | It’s usually a good idea to think about the different events that could be logged now and in the future and to come up with a naming scheme and naming convention before logging events. |